Today trades on GBPUSD, EURUSD and FTSE100 and pivot levels
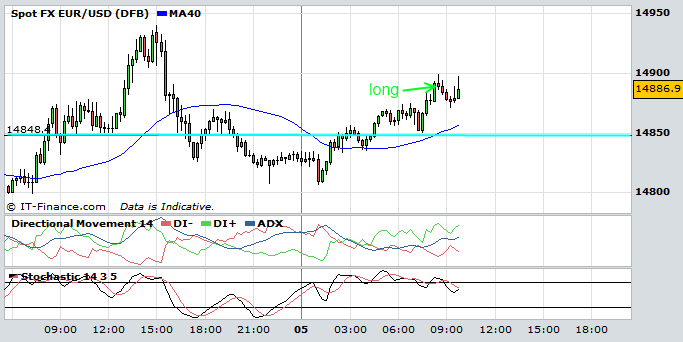
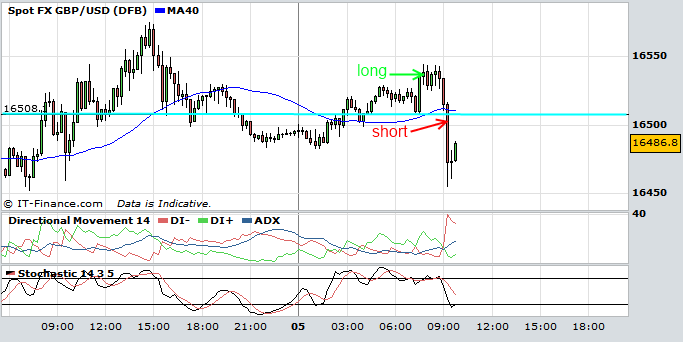
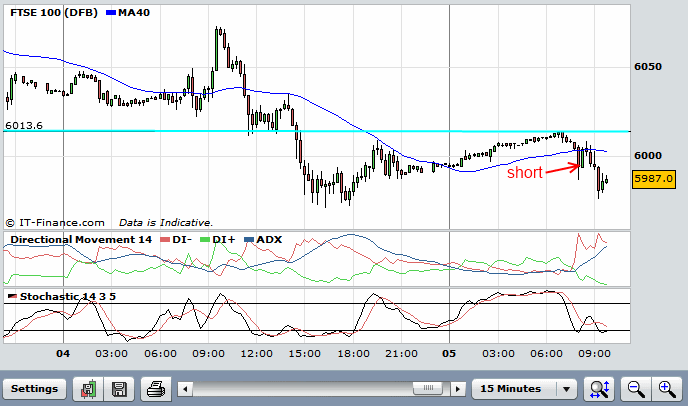
The pivots today were all very significant in trading today.. if you look at the blue pivot line in the charts below for all trade instruments (GBPUSD, EURUSD and FTSE), you can see how the price action reacted to the pivot line.
With the GBPUSD chart you can see how the market bouced off the pivot line at around 8am… shortly after this I went long which wasn’t a good trade as I ended up with -20 as the market went down. However, on hitting the pivot again, you could see that it provided no support. In cases like this you can expect a fall. I had an order just under the pivot with a 40 pip limit and got it!
Similar to the GBPUSD chart, the EURUSD price action had bounced off the pivot line and similarly, I entered long and as the price went up so did my trailing stop. When the market retraced, it hit my stop and I was out at a scratch trade.

Finally, the FTSE100 chart. The price action touched the pivot and then just fell away. I shorted as I saw the price action fall away and although it did retrace, it didn’t get near my stop before it fell again. The market has fallen slightly more since I’ve taken the pic and I’m out after the market hit the previous low of 5972 for +20.
So overall, I’m up today but only 40 pips! A profit is a profit… I can’t complain!


