The W Pattern in Oil Price
If you study stock price patterns, no doubt you would have come across the W or M pattern. These are also double bottom or double top patterns and signify potential reversals in the underlying asset class.
If you want to read more, there’s a nice article on Investopedia:
http://www.investopedia.com/university/charts/charts4.asp#axzz1WgQnxMpY
Anyway, these patterns can persist in all timeframes and I saw and traded oil with it last night.
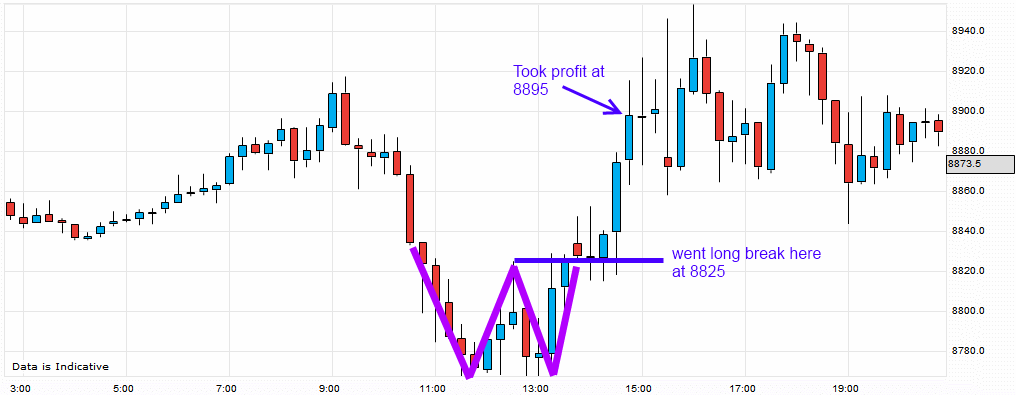
You can see that oil price made a W (outlined in pink) or a double bottom (support) at 8770 or so and the entry would be to enter long on the break of the retracement before the formation of the second bottom. This was at 8825 and I placed an order here to go long on the break of this. The target price should ideally be 8920 which was where the price fell from but the market usually responds to large round numbers so I had my target at just below 8900 at 8895.
This hit for 70 points but it did go beyond this and went as high at 8950 (which would have been another 55 points)


After analysing charts a great website to trade on is a smart options website. There you predict if a stock/commodity or anything else will go up or down within a given time frame. You get a 22 pound bonus sign up as well, visit http://www.onetwotrade.com/?IB=2018219
[…] http://www.makemesomemoney.co.uk/2011/09/01/the-w-pattern-in-oil-price/ […]