
The W Pattern in Oil Price
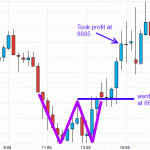
If you study stock price patterns, no doubt you would have come across the W or M pattern. These are also double bottom or double top patterns and signify potential reversals in the underlying asset class. If you want to read more, there's a nice article on Investopedia: http://www.investopedia.com/university/charts/charts4.asp#axzz1WgQnxMpY Anyway, these patterns can persist in all timeframes and I saw and traded oil with it last night. You can see that oil price made a W (outli