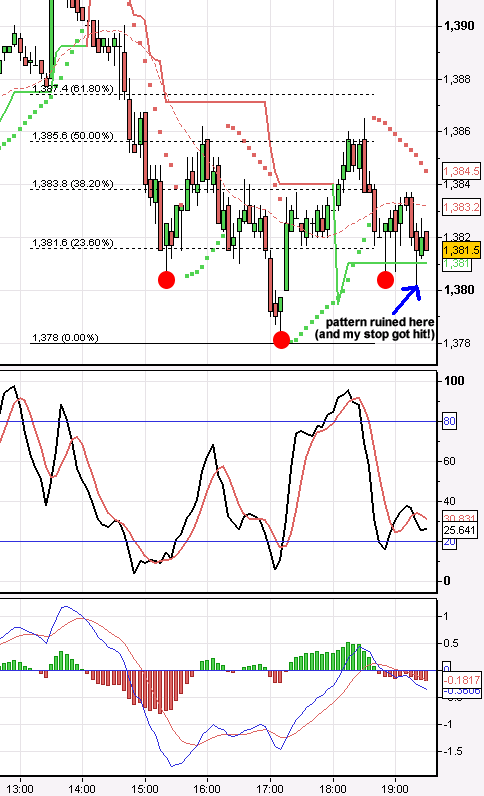
A perfect symmetical Head and Shoulders pattern on the S&P?

Today, I saw the perfect Head and Shoulders pattern on the S&P and got very excited. Look at the diagram, the 3 red dots signify the shoulders and head. I have read about this pattern in technical analysis books and in most cases, they signify a reversal pattern. I was looking at the chart moving up to at least 1388!! Anyway, I went long at the second shoulder.. the market moved 2 points up my direction.. it was looking good and then tanked, breaching the limits of the second shoulde


