Posts Tagged stockmarket

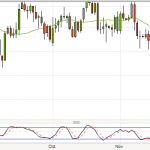
This was the chart of the FTSE a few days back when I went short... I was seeing some tails on the candlesticks and the market was overbought and looking ripe for a short. Where I went short was a slightly bearish bar despite there being a bullish tail showing buyers. To be honest, I remember feeling a bit overconfident with the trade was I'd been doing so well over the past couple of weeks...
The following day was when I felt that I was correct in my analysis as we were rewarded by a bea
November 29, 2012
No Comments Full Story

So it was an Obama victory and the Dow Jones fell over 300 points!! It was spectacular fall and a mass of profits to be made for those short.
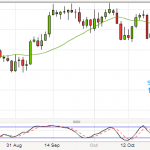
I actually had the perfect entry on this trade. I was short from 13230, near the close of yesterday candle. The market was in a downtrend on the Daily chart and you can see that the price had reject the 13300 level 3 times already and formed a resistance level.
The thing about trading technical signals is that I don't really care about what's happeni
November 7, 2012
1 Comment Full Story

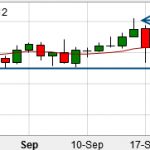
Below is a picture of the Crude Oil price chart... ok, at this level it doesn't look that interesting...
But if you zoom in a bit more...
This is what I am seeing.
The price made a high at A but fell rather strongly.. it even fell through the support line shown where it found support a bit lower down. However, confirmation of the support line which becomes resistance via the pin bar shows that sellers are now present here driving the price down. The price is right on support but
September 25, 2012
No Comments Full Story
« Older Entries


