DDFX trades – July 2011
I realised that although I had taken screenshots of the DDFX charts over the past couple of weeks, I hadn’t posted them all up on the blog. So here are a couple of annotated charts taken using the DDFX system:
EURJPY – 22nd to 28th July
You can see where I was uncomfortable with taking the short signal. I didn’t like how the sell arrows were staggered and by the time I got all 3 arrows, the market had already moved somewhat too far already. Shortly afterwards, I get a ‘buy’ signal… though this is not really a buy as it was only one up arrow and the major trend didn’t confirm the entry. However, on the 26th, I got long at 113.30 which was after the spike up.. this was a tad annoying as the market drifted and I got out for a 48 pip loss as soon as the sell arrow and first red bar appeared.
I sold a few hours later once all the trend indicators lined up, a second sell arrow signal appeared and I got short at 112.83. This was a lovely ride downwards for 143 pips.
Total therefore was 95 pips for this period on EURJPY
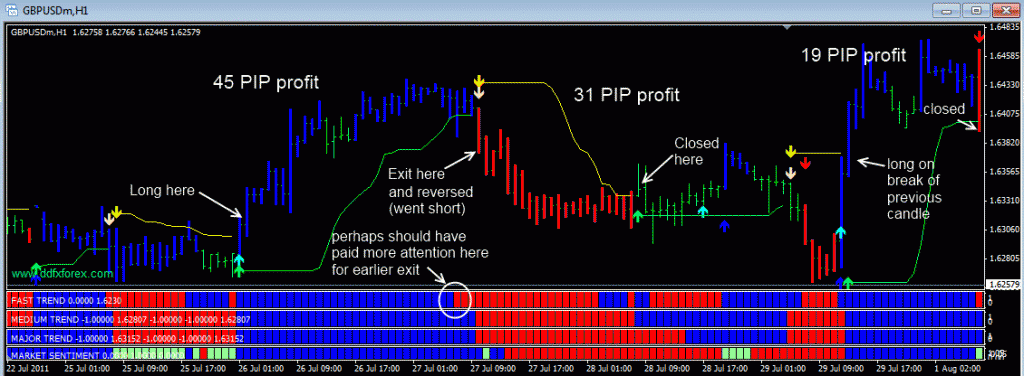
GBPUSD – 25th to 29th July
First signal was on the 26th. Trend indicators lined up and two long arrows. I took this all the way until I got my first red bar and the sell arrows. You can see that if I had used the trend indicators I could have got out sooner with a better pip count. However, I took 45 pips on this on the close of the long. I had reversed too (ie my order to sell was double normal size – to close and to open a short trade). This was a nice trade for 31 pips. Towards the right of the chart, you can see a large movement.. however, I didn’t get in on the trade until after the move had happened and momentum didn’t continue much more and I sold at the first red bar for a 19 pip profit.
Total for this period for GBPUSD also 95 pips.
To learn more about the DDFX Forex Trading system click here.


