Archive for the Trading Category

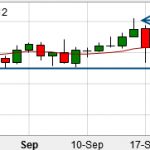
Below is a picture of the Crude Oil price chart... ok, at this level it doesn't look that interesting...
But if you zoom in a bit more...
This is what I am seeing.
The price made a high at A but fell rather strongly.. it even fell through the support line shown where it found support a bit lower down. However, confirmation of the support line which becomes resistance via the pin bar shows that sellers are now present here driving the price down. The price is right on support but
September 25, 2012
No Comments Full Story

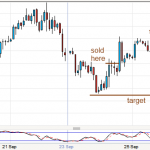
This was most annoying. I had sold the DOW last night as you know with a 50 point stop and target. The price moved up and took out my stop before it plumetted.. it would have hit my target as you can see nicely. It's always difficult to know where to put your stop.. it can always be either too tight or too far away.. you just have to stick to your plan.
In fact, I think in the coming days we may see lower prices.. all markets seem primed to move lower but they will do what they need to do
September 25, 2012
No Comments Full Story

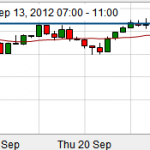
The DOW looks like it's reached a top, a triple top in fact... in the 4 hour chart below, you can see clear resistance where the market has bounced off this showing a pin bar. Looks like there are strong sellers here in the market and a potential place to go short. I have put on a sell at 13560, looking to take this 50 points down to 13510 (which is just above the support level you can see). 50 point stop also.
This is a risk of 1% on my account.
September 24, 2012
No Comments Full Story
« Older Entries
Newer Entries »


