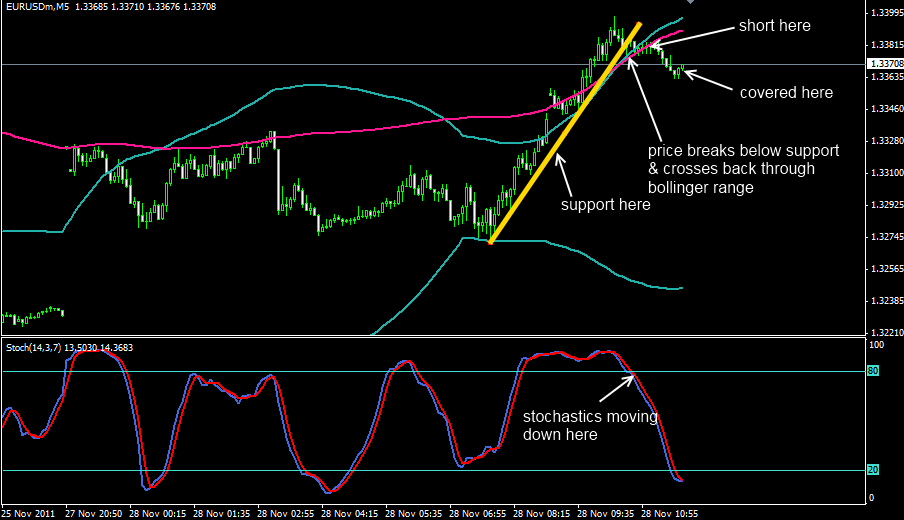
A short term trade on EURUSD – bollinger bands, stochastics and break of support
I don’t usually trade off the 5 minute charts but sometimes you fancy doing some scalping when you’re at a loose end. Most of my trading focuses on the 1 hour or the daily charts.. with these, you don’t need to be at the screen so much and I’ve found that you don’t worry so much about the ‘noise’ in the market.
Anyway, here is a trade which I took from the 5 minute charts for a paltry 6 pips (I got out as the price action looked as though it wanted to go up and also the stochastics were indicating that the price was now oversold).
This focuses on a break of the support line as you can see and crossing and coming back into the bollinger bands. The stochastics were also indicating that the price action was overbought.


