How I select which Pinbars to Trade
A lot of my trades have been off pinbars. Pinbars are great in that they show where there was some strong buying or selling. This gives you a clue as to what may happen next so it could potentially be a good place to place a trade in the direction of the pinbar and a stop underneath the wick. I’m writing in the context of bullish pinbars here but the same is true for bearish pinbars.
All my trades with pinbars are off the Daily charts.. I don’t trade the intraday timeframes as I want more time in my life.. this is just personal preference and I’ve not tested my pinbar setups within the smaller timeframes.
Anyway, this post is more about pinbar selection.. how can you increase the chances of taking a trade off a Daily chart. It’s by no means perfect as trading isn’t perfect but it has allowed me to become a bit more discriminate when trading pinbars.
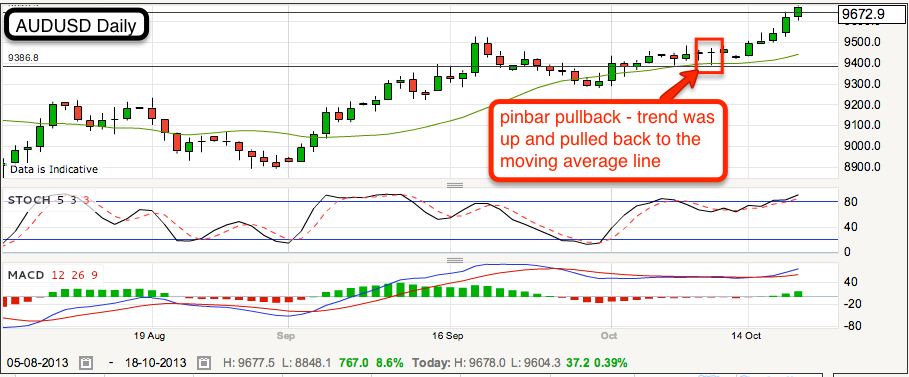
Pullback Pinbars
This is when there is a trend and it looks like the price action is taking a breather and pulling back. You see a pinbar in the direction of the trend. You would enter at the market price with the stop 10 pips below the lowest point on the pinbar.
Massive Move Pinbar
This is a countertrend place and generally one which you have to be a bit more careful of. Basically the market has made a massive move along with the trend. Now, it’s never easy to define a massive move but I tend to view it as a move which is a few magnitude larger than the previous ones. A pinbar after this move could be a good opportunity to go against it.. generally large moves are overdone and will bounce the other way. I will look for the next resistance levels to get out or if you follow the price action, get out as soon as it looks/feels dodgy.
Pinbar on Support or Resistance
Generally, if there’s a clear area where the market has bounced a couple of times. if you see a pinbar form.. that’s a good place to enter
Reversals
This one is a bit like the one above.. the price action is moving in accordance to it’s trend until it looks like it hits resistance or support and bounces a couple of times. You may see multiple wicks to see support or resistance and the price action is ‘rounded’ showing gradual trend weakness. It’s not easy to define this exactly but I hope the charts indicate what I’m looking for.
So that’s how I look at pinbars and use them for trading the financial markets. I hope you’ll find that useful.


[…] Pinbar against a strong trend (unless its a Massive Move Pinbar – see http://www.makemesomemoney.co.uk/select-pinbars-trade/) […]