More mistakes – S&P emini trading log

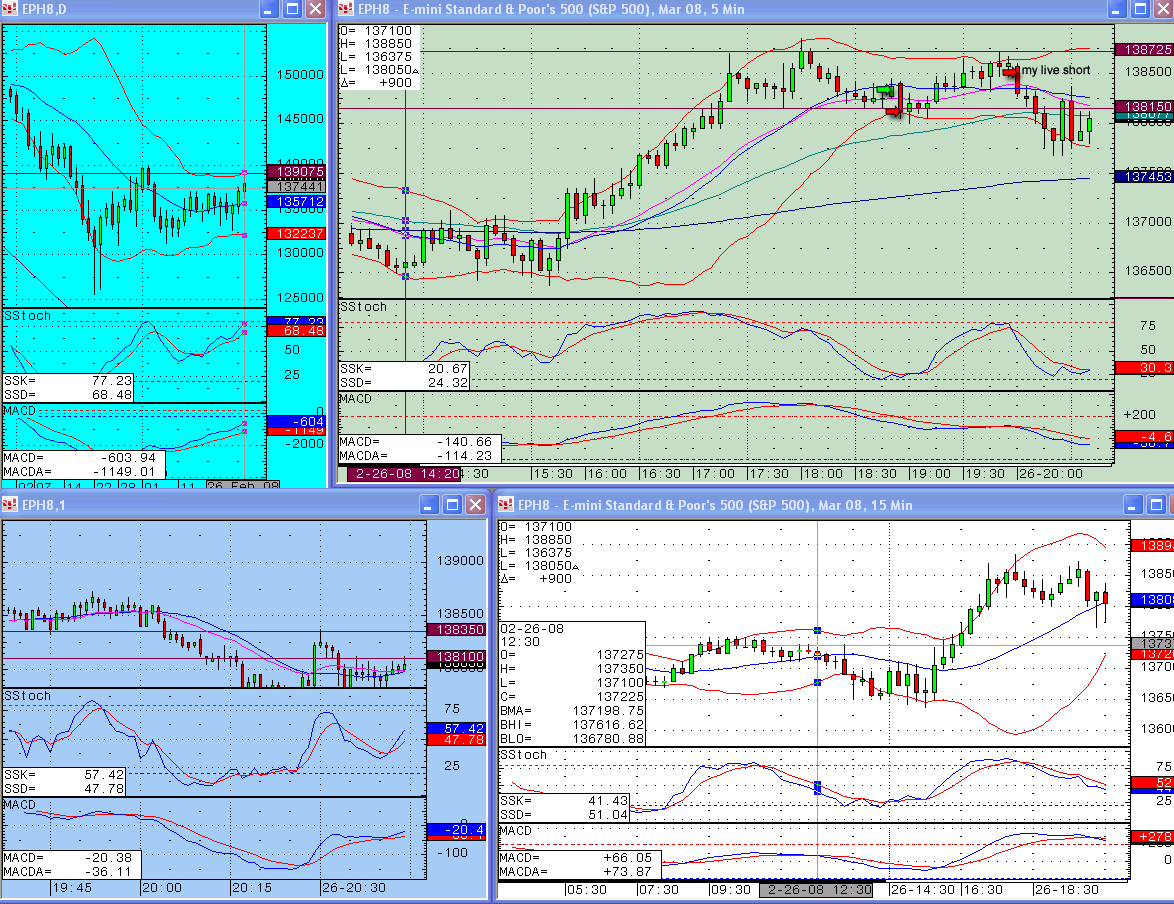
I have shown just my entries in my attached chart... it was another bad day! I entered long where the arrow is green at 138425. I could see that the 5 min stochastics were in oversold territory so there would be a move upwards soon.. was it here? However, if I paid more attention to the 15 min chart, I could see that it was telling me something different, the MACD had cross towards the downside and indicating a short. The conflict of signals should have been a warning! Anyway, I ended up


